NIFTY 50

DISCLAIMER : THIS IS NOT A TRADING ADVICE, BUT ARE MY THOUGHTS / DISCUSSIONS WITH THOSE WHO ARE INTERESTED IN THE USEFUL APPLICATION OF TECHNICAL ANALYSIS.THIS IS FOR STUDY PURPOSE AND ENTERTAINMENT. WHILE DUE CARE HAS BEEN TAKEN IN PREPARING THESE NOTES/COMMENTS, NO RESPONSIBILITY CAN BE OR IS ASSUMED FOR ANY CONSEQUENCES RESULTING OUT OF ACTING ON THEM.TRADING IN STOCKS/COMMODITIES/FUTURES CARRY RISK.CONSULT YOUR FINANCIAL ADVISOR / SEBI REGISTERED RESEARCH ANALYST ONLY BEFORE YOU TRADE.THIS IS NOT A BUY / SELL RECOMMENDATION  .ONLY BROAD MARKET TRENDS ARE DISCUSSED HERE.I AM NOT A SEBI REGISTERED TECHNICAL ANALYST.

NOTE : In order to give benefit of this blog to the readers , I expect that the readers have adequate knowledge of Elliott waves.In my writing I some times write “a wave may reach a certain point or may not reach it”.To elaborate on 22 nd January,2019 ( view for 23 rd January)  I had written that NIFTY may go to 10960 ( or may not go also).I expect that the readers know that the “B” wave of a Zigzag can retrace 10 %- 79 %  of wave A.So it can retrace any % age based on pattern formed e.g a “B” wave running triangle will retrace 10-38 %, a regular triangle may retrace 38.2-50 % etc.So on January 22 nd NIFTY had already retraced more than 50 % so chances were it may retrace full 79 % and then fall for wave C or start falling from this point itself.So please brush your Elliott wave basics if you want to take benefit from my blog. 

10,831.50  -91.25   – 0.84% 

VIEW FOR 24/01/2019 ONWARDS

NIFTY formed a zigzag as written in my earlier post and broke 10864 and 10844 and finally came to 10831-10800 levels.

Now once the zigzag is over what next ? 

Scenario 1: If Downward movement accelerates, do not touch it.

Scenario 2: If NIFTY stays above 10830, or preferably 10882 ( green line), expect it to go to 10930 and above.This scenario gives many possibilities i.e it may start wave (iii) Up which will be very bullish or wave “b” to form a flat for wave (ii) or an “x” wave to form a double zigzag or double combination.

Overall I feel that once NIFTY comfortably stays above 10830, – 10930 +  will be reached.Next course will depend on the fresh wave made.

Anytime it should not break 10692.30 if NIFTY is bullish.

NIFTY HOURLY

nifty hourly


NIFTY 50

DISCLAIMER : THIS IS NOT A TRADING ADVICE, BUT ARE MY THOUGHTS / DISCUSSIONS WITH THOSE WHO ARE INTERESTED IN THE USEFUL APPLICATION OF TECHNICAL ANALYSIS.THIS IS FOR STUDY PURPOSE AND ENTERTAINMENT. WHILE DUE CARE HAS BEEN TAKEN IN PREPARING THESE NOTES/COMMENTS, NO RESPONSIBILITY CAN BE OR IS ASSUMED FOR ANY CONSEQUENCES RESULTING OUT OF ACTING ON THEM.TRADING IN STOCKS/COMMODITIES/FUTURES CARRY RISK.CONSULT YOUR FINANCIAL ADVISOR / SEBI REGISTERED RESEARCH ANALYST ONLY BEFORE YOU TRADE.THIS IS NOT A BUY / SELL RECOMMENDATION  .ONLY BROAD MARKET TRENDS ARE DISCUSSED HERE.I AM NOT A SEBI REGISTERED TECHNICAL ANALYST.

10,922.75   -39.10   – 0.36 % 

VIEW FOR 23/01/2019 ONWARDS

NIFTY, I had said should not break 10882 or 10844.70 if the bullish count is valid.NIFTY today broke 10882 and made a low of 10864.20.It did not break 10844.20 but has made me change the wave count slightly.

NIFTY may go upto 10960 ( or may not go also) and then can come down to break 10864.2 and in the process may break 10844.20. It is forming a zigzag for wave (ii).Strong support exists in the zone 10830-10800.For the wave count to be valid i.e bullish, NIFTY should not break 10692 shown in green.Anytime NIFTY stays above 10987.50 for more than 4 hours, it is bullish.

NIFTY HOURLY

nifty hourly


NIFTY 50

DISCLAIMER : THIS IS NOT A TRADING ADVICE, BUT ARE MY THOUGHTS / DISCUSSIONS WITH THOSE WHO ARE INTERESTED IN THE USEFUL APPLICATION OF TECHNICAL ANALYSIS.THIS IS FOR STUDY PURPOSE AND ENTERTAINMENT. WHILE DUE CARE HAS BEEN TAKEN IN PREPARING THESE NOTES/COMMENTS, NO RESPONSIBILITY CAN BE OR IS ASSUMED FOR ANY CONSEQUENCES RESULTING OUT OF ACTING ON THEM.TRADING IN STOCKS/COMMODITIES/FUTURES CARRY RISK.CONSULT YOUR FINANCIAL ADVISOR / SEBI REGISTERED RESEARCH ANALYST ONLY BEFORE YOU TRADE.THIS IS NOT A BUY / SELL RECOMMENDATION  .ONLY BROAD MARKET TRENDS ARE DISCUSSED HERE.I AM NOT A SEBI REGISTERED TECHNICAL ANALYST.

10,961.85  +54.90   + 0.50% 

VIEW FOR 22/01/2019 ONWARDS

I had been saying in all my previous posts that if NIFTY stays above 10931.2 , it will be bullish.Also I had thought that wave (ii) may prolong but it did not happen.Today morning from the opening itself may be after half an hour NIFTY was above 10931.20.

So overall trend in NIFTY is bullish as it will be forming a larger circled wave iii. Anytime it should not break below 10882 or worst 10844.70 to remain bullish.Bullish Wave counts will be negated below these levels.

NIFTY HOURLY

nifty hourly

NSE 50

DISCLAIMER : THIS IS NOT A TRADING ADVICE, BUT ARE MY THOUGHTS / DISCUSSIONS WITH THOSE WHO ARE INTERESTED IN THE USEFUL APPLICATION OF TECHNICAL ANALYSIS.THIS IS FOR STUDY PURPOSE AND ENTERTAINMENT. WHILE DUE CARE HAS BEEN TAKEN IN PREPARING THESE NOTES/COMMENTS, NO RESPONSIBILITY CAN BE OR IS ASSUMED FOR ANY CONSEQUENCES RESULTING OUT OF ACTING ON THEM.TRADING IN STOCKS/COMMODITIES/FUTURES CARRY RISK.CONSULT YOUR FINANCIAL ADVISOR / SEBI REGISTERED RESEARCH ANALYST ONLY BEFORE YOU TRADE.THIS IS NOT A BUY / SELL RECOMMENDATION  .ONLY BROAD MARKET TRENDS ARE DISCUSSED HERE.I AM NOT A SEBI REGISTERED TECHNICAL ANALYST.

10,906.95   +1.75  + 0.02% 

VIEW FOR 21/01/2019 ONWARDS

I had said in my previous post that if NIFTY stayed above 10931 for 4 hours or so, then we can consider that wave (ii) is complete.Forget about staying above 10931 for hours, NIFTY did not  go above 10931 at all.

So for wave (ii) here, NIFTY may be forming a complex correction.It may mimmick the previous circled wave ii of  2 degrees  higher  which was “abc -X -triangle”. So once wave (ii) is complete, overall the current wave with all it’s subwaves will finally cross 11760 or at the least cross 11400 +.

NIFTY HOURLY

nifty hourly

NIFTY 50

DISCLAIMER : THIS IS NOT A TRADING ADVICE, BUT ARE MY THOUGHTS / DISCUSSIONS WITH THOSE WHO ARE INTERESTED IN THE USEFUL APPLICATION OF TECHNICAL ANALYSIS.THIS IS FOR STUDY PURPOSE AND ENTERTAINMENT. WHILE DUE CARE HAS BEEN TAKEN IN PREPARING THESE NOTES/COMMENTS, NO RESPONSIBILITY CAN BE OR IS ASSUMED FOR ANY CONSEQUENCES RESULTING OUT OF ACTING ON THEM.TRADING IN STOCKS/COMMODITIES/FUTURES CARRY RISK.CONSULT YOUR FINANCIAL ADVISOR / SEBI REGISTERED RESEARCH ANALYST ONLY BEFORE YOU TRADE.THIS IS NOT A BUY / SELL RECOMMENDATION  .ONLY BROAD MARKET TRENDS ARE DISCUSSED HERE.I AM NOT A SEBI REGISTERED TECHNICAL ANALYST.

10,905.20   + 14.90   +0.14% 

VIEW FOR 18/01/2019 ONWARDS

NIFTY touched 10844.7 near the 38.2 % fibonacci ratio which is at 10837.78. I have put a question mark near wave (ii) to indicate that wave (ii) may or maynot be over.If wave (ii) is complete then NIFTY should stay above 10931 for 3-4 hours and go up to touch higher levels to make wave (iii).

If wave (ii) is not over we may test lower levels.Chart is self illustrative.

NIFTY HOURLY

nifty hourly


NIFTY 50

DISCLAIMER : THIS IS NOT A TRADING ADVICE, BUT ARE MY THOUGHTS / DISCUSSIONS WITH THOSE WHO ARE INTERESTED IN THE USEFUL APPLICATION OF TECHNICAL ANALYSIS.THIS IS FOR STUDY PURPOSE AND ENTERTAINMENT. WHILE DUE CARE HAS BEEN TAKEN IN PREPARING THESE NOTES/COMMENTS, NO RESPONSIBILITY CAN BE OR IS ASSUMED FOR ANY CONSEQUENCES RESULTING OUT OF ACTING ON THEM.TRADING IN STOCKS/COMMODITIES/FUTURES CARRY RISK.CONSULT YOUR FINANCIAL ADVISOR / SEBI REGISTERED RESEARCH ANALYST ONLY BEFORE YOU TRADE.THIS IS NOT A BUY / SELL RECOMMENDATION  .ONLY BROAD MARKET TRENDS ARE DISCUSSED HERE.I AM NOT A SEBI REGISTERED TECHNICAL ANALYST.

10,890.30     + 3.50     +0.03% 

NIFTY VIEW FOR 17/01/2019 ONWARDS

NIFTY is making wave (ii) , or may have completed it.If not complete, wave (ii) can retrace upto  10837.8,  10809.74,10781.71 which are fibonacci ratios.It is not compulsory that wave (ii) has to retrace that much.I have shown support levels if NIFTY retraces.After wave (ii) wave (iii) up will start.

If this pattern is valid, then NIFTY should not break 10692.30 to the downside.Upward targets are above 11400 + .

NIFTY HOURLY

nifty hourly

NIFTY 50

DISCLAIMER : THIS IS NOT A TRADING ADVICE, BUT ARE MY THOUGHTS / DISCUSSIONS WITH THOSE WHO ARE INTERESTED IN THE USEFUL APPLICATION OF TECHNICAL ANALYSIS.THIS IS FOR STUDY PURPOSE AND ENTERTAINMENT. WHILE DUE CARE HAS BEEN TAKEN IN PREPARING THESE NOTES/COMMENTS, NO RESPONSIBILITY CAN BE OR IS ASSUMED FOR ANY CONSEQUENCES RESULTING OUT OF ACTING ON THEM.TRADING IN STOCKS/COMMODITIES/FUTURES CARRY RISK.CONSULT YOUR FINANCIAL ADVISOR / SEBI REGISTERED RESEARCH ANALYST ONLY BEFORE YOU TRADE.THIS IS NOT A BUY / SELL RECOMMENDATION  .ONLY BROAD MARKET TRENDS ARE DISCUSSED HERE.I AM NOT A SEBI REGISTERED TECHNICAL ANALYST.

10737.6     -57.35   – 0.53 %

NIFTY VIEW FOR 15/01/2019 ONWARDS

NIFTY is moving as shown in View 1 / View 2 in my previous charts.I had been bearish since January 7 th, 2019.NIFTY has touched my first target of 10737-10700 ,I am keeping the wave counts unchanged.Keep in mind the View 2 pattern also since NIFTY is losing momentum to the downside.

VIEW 1

A move above 10923.60 negates it.But since I have been bearish from 10860 levels, I feel keeping a tight stoploss to lock in the gains is a good idea.If this pattern is valid then NIFTY will break 10534.5 – see the roadmap.

NIFTY HOURLY

nifty hourly 1

VIEW 2

Here NIFTY breaks above the upper trendline of the triangle at 10830 and preferable levels are 10850-10870 to be more valid.NIFTY can break the a-c trendline to the downside but should not break 10628.70 at any point if this pattern has to be valid.This pattern also looks very probable.A break of b-d trendline confirms the uptrend.

NIFTY HOURLY

nifty hourly 2


NIFTY 50

DISCLAIMER : THIS IS NOT A TRADING ADVICE, BUT ARE MY THOUGHTS / DISCUSSIONS WITH THOSE WHO ARE INTERESTED IN THE USEFUL APPLICATION OF TECHNICAL ANALYSIS.THIS IS FOR STUDY PURPOSE AND ENTERTAINMENT. WHILE DUE CARE HAS BEEN TAKEN IN PREPARING THESE NOTES/COMMENTS, NO RESPONSIBILITY CAN BE OR IS ASSUMED FOR ANY CONSEQUENCES RESULTING OUT OF ACTING ON THEM.TRADING IN STOCKS/COMMODITIES/FUTURES CARRY RISK.CONSULT YOUR FINANCIAL ADVISOR / SEBI REGISTERED RESEARCH ANALYST ONLY BEFORE YOU TRADE.THIS IS NOT A BUY / SELL RECOMMENDATION  .ONLY BROAD MARKET TRENDS ARE DISCUSSED HERE.I AM NOT A SEBI REGISTERED TECHNICAL ANALYST.

10821.6   -33.55   -0.31%

NIFTY VIEW FOR 11/01/2019 ONWARDS

NOTE  :Yesterday I had posted daily charts instead of Hourly charts, I have edited the heading today as “NIFTY Daily “.Sorry for the mistake.

NIFTY is moving in a narrow range, So counts are unchanged.If correct, NIFTY should not break 10923.6 to the upside and try to touch the blue trendline down trying to break 10534 in the process.A move above 10923.6 negates the bearish count.

NIFTY HOURLY

nifty 1

Another Count – this is less bearish as to the depth of the correction.Here correction may come only to 10737-10700 range and then break the upper trendline at 10870.Preferable and safe levels for upward break confirmations are 10900 /10923.60.

NIFTY HOURLY

nifty 2

NIFTY 50

DISCLAIMER : THIS IS NOT A TRADING ADVICE, BUT ARE MY THOUGHTS / DISCUSSIONS WITH THOSE WHO ARE INTERESTED IN THE USEFUL APPLICATION OF TECHNICAL ANALYSIS.THIS IS FOR STUDY PURPOSE AND ENTERTAINMENT. WHILE DUE CARE HAS BEEN TAKEN IN PREPARING THESE NOTES/COMMENTS, NO RESPONSIBILITY CAN BE OR IS ASSUMED FOR ANY CONSEQUENCES RESULTING OUT OF ACTING ON THEM.TRADING IN STOCKS/COMMODITIES/FUTURES CARRY RISK.CONSULT YOUR FINANCIAL ADVISOR / SEBI REGISTERED RESEARCH ANALYST ONLY BEFORE YOU TRADE.THIS IS NOT A BUY / SELL RECOMMENDATION  .ONLY BROAD MARKET TRENDS ARE DISCUSSED HERE.I AM NOT A SEBI REGISTERED TECHNICAL ANALYST.

10,855.15   + 53.00   +0.49% 

NIFTY VIEW FOR 10/01/2019 ONWARDS

I said yesterday that a move above 10836 will “threaten” the count and a move above 10923.6 will invalidate it.NIFTY was above 10836 from the opening itself but did not go above 10923.60.So count remains valid.

Also I said only a move above 10890-10900 level i.e the blue channel lines will be bullish.As you can see NIFTY got resisted at the Upper trend channel at 10870.

Right now I am giving two scenarios of what may happen.

VIEW 1 : If NIFTY does not break 10923.60 to the upside, then it will break 10534 in the coming days.Here downside is capped to 10333.80.In either case (i.e view 1 and view 2) we should not break 10333.80.Overall trend is bullish.

NIFTY DAILY

nifty hourly 2

NIFTY DAILY

VIEW 2 : If NIFTY breaks above 10923.6 and preferably 10986, then we are bullish, then one can follow the blue lines shown in the roadmap.

nifty hourly 1


NIFTY 50

DISCLAIMER : THIS IS NOT A TRADING ADVICE, BUT ARE MY THOUGHTS / DISCUSSIONS WITH THOSE WHO ARE INTERESTED IN THE USEFUL APPLICATION OF TECHNICAL ANALYSIS.THIS IS FOR STUDY PURPOSE AND ENTERTAINMENT. WHILE DUE CARE HAS BEEN TAKEN IN PREPARING THESE NOTES/COMMENTS, NO RESPONSIBILITY CAN BE OR IS ASSUMED FOR ANY CONSEQUENCES RESULTING OUT OF ACTING ON THEM.TRADING IN STOCKS/COMMODITIES/FUTURES CARRY RISK.CONSULT YOUR FINANCIAL ADVISOR / SEBI REGISTERED RESEARCH ANALYST ONLY BEFORE YOU TRADE.THIS IS NOT A BUY / SELL RECOMMENDATION  .ONLY BROAD MARKET TRENDS ARE DISCUSSED HERE.I AM NOT A SEBI REGISTERED TECHNICAL ANALYST.

10,802.15    + 30.35    + 0.28% 

NIFTY VIEW FOR 09/01/2019 ONWARDS

I have kept the wave count unchanged.If NIFTY is forming (c) wave down then 10534 should be broken to the downside in the coming days.If NIFTY breaks 10836 to the upside then this count is threatened  .A move above 10923.6 invalidates this count.

Either we may have completed circled wave ii or may be forming circled wave ii as mentioned above.I have drawn Blue Channelled trendlines.Better to watch these lines.A move above the channel at 10890 or 10900 signals the start of the upmove.Till we move between the blue channel lines, we are correcting.

Overall trend is bullish, NIFTY is correcting where only depth of correction will vary and after the correction is over, NIFTY will resume the Uptrend.Also see I have marked that correction might be over , if so, it should break the upper end of the blue channelled lines soon.

If trend is bullish 10333.80 should not be broken.

NIFTY HOURLY

nifty hourly 1

NIFTY 50

DISCLAIMER : THIS IS NOT A TRADING ADVICE, BUT ARE MY THOUGHTS / DISCUSSIONS WITH THOSE WHO ARE INTERESTED IN THE USEFUL APPLICATION OF TECHNICAL ANALYSIS.THIS IS FOR STUDY PURPOSE AND ENTERTAINMENT. WHILE DUE CARE HAS BEEN TAKEN IN PREPARING THESE NOTES/COMMENTS, NO RESPONSIBILITY CAN BE OR IS ASSUMED FOR ANY CONSEQUENCES RESULTING OUT OF ACTING ON THEM.TRADING IN STOCKS/COMMODITIES/FUTURES CARRY RISK.CONSULT YOUR FINANCIAL ADVISOR / SEBI REGISTERED RESEARCH ANALYST ONLY BEFORE YOU TRADE.THIS IS NOT A BUY / SELL RECOMMENDATION  .ONLY BROAD MARKET TRENDS ARE DISCUSSED HERE.

10,771.80    + 44.45

NIFTY VIEW FOR 08/01/2019 ONWARDS

RECAP OF WHAT I SAID ON  4TH JANUARY  AND WHAT HAPPENED 

I said on Friday that we may reach 10812 once we  break the trendline ( I am mentioning Friday because I gave daily charts today morning and last Hourly Update was on Friday).NIFTY reached there today.

All patterns shown below are bullish, only depth of correction varies.

I will summarize the main points.

a) Anytime NIFTY breaks 10923.60 and preferably 10986 to the upside, we are bullish.

b) If NIFTY fails to break 10628 or 10534 to the downside, then also uptrend may start from here.

c) Anytime NIFTY should not break 10333.80 if it is  bullish.

d) Rest – charts are self explanatory.

NIFTY HOURLY  VIEW 1

nifty hourly 1


NIFTY HOURLY  VIEW 2

nifty hourly 2


NIFTY HOURLY  VIEW 3

nifty hourly 3

NIFTY 50

DISCLAIMER : THIS IS NOT A TRADING ADVICE, BUT ARE MY THOUGHTS / DISCUSSIONS WITH THOSE WHO ARE INTERESTED IN THE USEFUL APPLICATION OF TECHNICAL ANALYSIS.THIS IS FOR STUDY PURPOSE AND ENTERTAINMENT. WHILE DUE CARE HAS BEEN TAKEN IN PREPARING THESE NOTES/COMMENTS, NO RESPONSIBILITY CAN BE OR IS ASSUMED FOR ANY CONSEQUENCES RESULTING OUT OF ACTING ON THEM.TRADING IN STOCKS/COMMODITIES/FUTURES CARRY RISK.CONSULT YOUR FINANCIAL ADVISOR / SEBI REGISTERED RESEARCH ANALYST ONLY BEFORE YOU TRADE.THIS IS NOT A BUY / SELL RECOMMENDATION  .ONLY BROAD MARKET TRENDS ARE DISCUSSED HERE.

10,727.35   + 55.10  +0.52% 

NIFTY VIEW FOR 07/01/2019 ONWARDS

RECAP OF WHAT I SAID AND WHAT HAPPENED : I  said a break of the green trendline to the Upside is necessary if NIFTY should start to go up.NIFTY went upto 10729 in the early morning trade , but did not break the trendline and came down to break 10661 and then at 12.44 pm it broke the green trendline to the Upside.The moment it broke the trendline, it went up to touch 10736.

NIFTY HOURLY

nifty hourly 1


What I Think Now : Today I am showing DAILY charts and not hourly charts to show a bit longer term view as requested by many of my readers.

VIEW 1

This view is bullish.Here either NIFTY has completed circled wave – ii and is on the journey to higher levels or if  circled wave ii is not over , then follow the red and blue roadmap.In this case it should not break 10333.80.

THESE ARE DAILY CHARTS AND NOT HOURLY CHARTS WHICH I POST REGULARLY

NIFTY DAILY

nifty 1

ALTERNATE VIEW 2

This is a very bearish view  but not a preferred count as of now, where NIFTY is currently forming a triangle in a complex correction (W)-(X)-(Y).NIFTY is currently forming wave “E”, if so it should not break 10923.60 The moment it completes the wave “E” and breaks the lower “B-D” trendline and preferably after 10333,all hell will break loose.Though do not jump to this count at the fall of a Hat as there is some lacuna in the wave count.If we exhaust all possibilities of bullishness, we will take this count.

NIFTY DAILY

nifty 2


NIFTY 50

DISCLAIMER : THIS IS NOT A TRADING ADVICE, BUT ARE MY THOUGHTS / DISCUSSIONS WITH THOSE WHO ARE INTERESTED IN THE USEFUL APPLICATION OF TECHNICAL ANALYSIS.THIS IS FOR STUDY PURPOSE AND ENTERTAINMENT. WHILE DUE CARE HAS BEEN TAKEN IN PREPARING THESE NOTES/COMMENTS, NO RESPONSIBILITY CAN BE OR IS ASSUMED FOR ANY CONSEQUENCES RESULTING OUT OF ACTING ON THEM.TRADING IN STOCKS/COMMODITIES/FUTURES CARRY RISK.CONSULT YOUR FINANCIAL ADVISOR / SEBI REGISTERED RESEARCH ANALYST ONLY BEFORE YOU TRADE.THIS IS NOT A BUY / SELL RECOMMENDATION  .ONLY BROAD MARKET TRENDS ARE DISCUSSED HERE.

10,672.25     -120.25  -1.11% 

NIFTY VIEW FOR 04/01/2019 ONWARDS

RECAP OF WHAT I SAID AND WHAT HAPPENED :There is nothing much to say regarding yesterday since I said I am on sidelines till I get clarity.

 Both the patterns are similar till now as an Impulse wave is forming.

What I Think Now :

VIEW  – 1

The pattern given below is forming an Impulse wave down i.e “C” wave of a Flat for wave (2).If so, it should conclude soon.Conclusion of an Impulse wave will happen on the break of 2-4 trendline shown in Green colour.ONLY if NIFTY breaks the Green trendline to the Upside, it will test 4 th wave levels shown in the graph i.e 10736-10812.

Consequently if it stays above 10812 consistently, we can say that this pattern is valid.If this pattern is valid NIFTY should not break the low made today 10661.25 or any low that will be made in the morning of 4 th January (if at all).Nifty will then break 10986 to the upside and move upwards.

Read the NOTE given in the end

NIFTY HOURLY

NIFTY 1

VIEW  – 2

Here also pattern is similar i.e currently we are forming an Impulse pattern as above. Here also NIFTY may break the parallel channels, go upwards to the 4 th wave zone of 10736-10812.Then it WILL come down to BREAK 10661.25 or any new Low made in the morning of  January 4 th.

OR it maynot break the green parallel lines to the upside and continue to make lower lows.

NIFTY HOURLY

NIFTY 2

NOTE

Beware – Both patterns MAY look similar upto the bounce to the 4 th wave zone.Difference comes after touching the 4 th wave zone, View 1 will continue to go up and in View 2 it will start going down.

Also it may so happen that from morning itself if we make continuous lower lows, then it may be View 2 and upward bounces may be short lived.

NIFTY 50

DISCLAIMER : THIS IS NOT A TRADING ADVICE, BUT ARE MY THOUGHTS / DISCUSSIONS WITH THOSE WHO ARE INTERESTED IN THE USEFUL APPLICATION OF TECHNICAL ANALYSIS.THIS IS FOR STUDY PURPOSE AND ENTERTAINMENT. WHILE DUE CARE HAS BEEN TAKEN IN PREPARING THESE NOTES/COMMENTS, NO RESPONSIBILITY CAN BE OR IS ASSUMED FOR ANY CONSEQUENCES RESULTING OUT OF ACTING ON THEM.TRADING IN STOCKS/COMMODITIES/FUTURES CARRY RISK.CONSULT YOUR FINANCIAL ADVISOR / SEBI REGISTERED RESEARCH ANALYST ONLY BEFORE YOU TRADE.THIS IS NOT A BUY / SELL RECOMMENDATION  .ONLY BROAD MARKET TRENDS ARE DISCUSSED HERE.

10,792.50  -117.60   -1.08%

NIFTY VIEW FOR 03/01/2019 ONWARDS

RECAP OF WHAT I SAID AND WHAT HAPPENED : Yesterday ,I said in one sentence if I have to predict the direction of NIFTY then it is -that NIFTY should cross 10986 if it has to be bullish, otherwise it will be bearish.Also confirmation of bearishness will come below break of 10825-10808 levels which was the lower end of the channel.NIFTY today broke below 10808 and touched a low of 10735.

WHEN IN DOUBT STAND ASIDE

Today I am not clear regarding wave counts, so I am standing aside.Reason for this being, I am getting one bullish and one bearish count.I would like to see the market resolve itself in one direction and then take a call.

I am showing both the counts, the reason why I am indecisive today.

NIFTY HOURLY

NIFTY 1

NIFTY HOURLY

NIFTY 2

NIFTY 50

DISCLAIMER : THIS IS NOT A TRADING ADVICE, BUT ARE MY THOUGHTS / DISCUSSIONS WITH THOSE WHO ARE INTERESTED IN THE USEFUL APPLICATION OF TECHNICAL ANALYSIS.THIS IS FOR STUDY PURPOSE AND ENTERTAINMENT. WHILE DUE CARE HAS BEEN TAKEN IN PREPARING THESE NOTES/COMMENTS, NO RESPONSIBILITY CAN BE OR IS ASSUMED FOR ANY CONSEQUENCES RESULTING OUT OF ACTING ON THEM.TRADING IN STOCKS/COMMODITIES/FUTURES CARRY RISK.CONSULT YOUR FINANCIAL ADVISOR / SEBI REGISTERED RESEARCH ANALYST ONLY BEFORE YOU TRADE.THIS IS NOT A BUY / SELL RECOMMENDATION  .ONLY BROAD MARKET TRENDS ARE DISCUSSED HERE.

10,910.10   + 47.55   + 0.44% 

NIFTY VIEW FOR 02/01/2019 ONWARDS

1) What I said in my previous post  :

I said in 2 nd para 3 rd and 4 th lines that the Up move is not yet over, since NIFTY made a 5 wave structure instead of 3 wave structure.

what happened:

NIFTY exactly followed what I said and made a higher high today in the last 5 minutes compared to yesterday’s high.It made a high of 10923.6 compared to 10923.5 yesterday.So it validated my point of view that Upmove was not over yesterday.

NOTE : A 3 – wave structure means 3,7,11 waves.A 5 -wave structure means 5,9,13 waves. A Corrective or Impulse waves can both be Up or Down depending on it’s occurence.

What I think now :

I have shown the markings on NIFTY.It may change.In one sentence if I have to say whether NIFTY is bullish or bearish, then   – A break above 10986 is bullish otherwise not. Right now since it is in a channel, it means it is in some type of corrective / sideways mode. A break above 10965 or below 10825-10807 are first signs that the sideways action is over.If NIFTY is bullish, then it need not break above 10986 tomorrow itself, but can do so in the coming 3-4 days.

NIFTY HOURLY

NIFTY Hourly 2

NIFTY 50

DISCLAIMER : THIS IS NOT A TRADING ADVICE, BUT ARE MY THOUGHTS / DISCUSSIONS WITH THOSE WHO ARE INTERESTED IN THE USEFUL APPLICATION OF TECHNICAL ANALYSIS.THIS IS FOR STUDY PURPOSE AND ENTERTAINMENT. WHILE DUE CARE HAS BEEN TAKEN IN PREPARING THESE NOTES/COMMENTS, NO RESPONSIBILITY CAN BE OR IS ASSUMED FOR ANY CONSEQUENCES RESULTING OUT OF ACTING ON THEM.TRADING IN STOCKS/COMMODITIES/FUTURES CARRY RISK.CONSULT YOUR FINANCIAL ADVISOR / SEBI REGISTERED RESEARCH ANALYST ONLY BEFORE YOU TRADE.THIS IS NOT A BUY / SELL RECOMMENDATION  .ONLY BROAD MARKET TRENDS ARE DISCUSSED HERE.

10,862.55   + 2.65   + 0.02% 

Wish readers of my Blog a very Peaceful, Happy, Prosperous,Wish-Fulfilling and Enjoyable New 2019.

NIFTY made a high of 10923.5, so mostly “view a” given yesterday is on it’s way out.Still will retain it for a day or two since NIFTY did not make any progress on closing basis.

I am showing the hourly chart,and showing that we have made 5 waves up.Since I am expecting a corrective wave Up according to “View a” as well as “view b” it has to be a “3” wave structure and not “5” wave.So the Up wave is not yet complete.The 1-5 marked are not Elliott wave markings but numerals to show 5 waves have taken place.If you remove 4 and 5 number then, maybe we are making a triangle for wave 4.

 Waiting for the pattern to get clearer, so keeping all the 3 views intact as of today .Refer to my yesterday’s post to get an idea about all three views posted by me.

NIFTY HOURLY

NIFTY Hourly


NIFTY 50

DISCLAIMER : THIS IS NOT A TRADING ADVICE, BUT ARE MY THOUGHTS / DISCUSSIONS WITH THOSE WHO ARE INTERESTED IN THE USEFUL APPLICATION OF TECHNICAL ANALYSIS.THIS IS FOR STUDY PURPOSE AND ENTERTAINMENT. WHILE DUE CARE HAS BEEN TAKEN IN PREPARING THESE NOTES/COMMENTS, NO RESPONSIBILITY CAN BE OR IS ASSUMED FOR ANY CONSEQUENCES RESULTING OUT OF ACTING ON THEM.TRADING IN STOCKS/COMMODITIES/FUTURES CARRY RISK.CONSULT YOUR FINANCIAL ADVISOR / SEBI REGISTERED RESEARCH ANALYST ONLY BEFORE YOU TRADE.THIS IS NOT A BUY / SELL RECOMMENDATION  .ONLY BROAD MARKET TRENDS ARE DISCUSSED HERE.

10,859.90    + 80.10  + 0.74% 

NIFTY VIEW FOR 30/12/2018 ONWARDS

1) What I said in my previous post  :

After “B” wave down is over, NIFTY will go to form wave “C” upwards which will complete wave “(B)” shown in red.

what happened:

NIFTY completed wave B and went up to form wave C from the opening itself.

2) What I said in my previous post  :

A move above 10900 will invalidate my count.

what happened:

NIFTY made a high of 10893.6 and retraced, which is less than 10900.

What I think now :

I have divided my view in 3 sections :

View a – If NIFTY does not go above 10910 ( Preferred View)

View b – If NIFTY goes above 10910 but remains below 10985.2 ( Alternate 1)

View c – If NIFTY goes above 10985.20 ( Alternate 2)

VIEW a (Preferred View)

 “(B)” wave of  Zigzag should retrace only 79 % of wave (A).In this case it is (10985.2-10534.5) X 79% which equals to 10890.Give a leeway of 20 points it comes to 10910.

So if this count is correct then NIFTY should start forming wave C down NOW which will break 10534.5.NIFTY retraced exactly from this point , making a high of 10893.6

A move above 10910 invalidates this count.

NIFTY HOURLY

NIFTY 1


VIEW b ( Alternate 1)

NIFTY if it goes above 10910 but does not cross 10985.2, then it will form wave (2) and then wave (3) will resume down- shown in the graph below.This is where a Zigzag and Impulse differentiate from each other, though there are further guidelines also.This is a very Bearish Count.

NIFTY HOURLY 

NIFTY 2


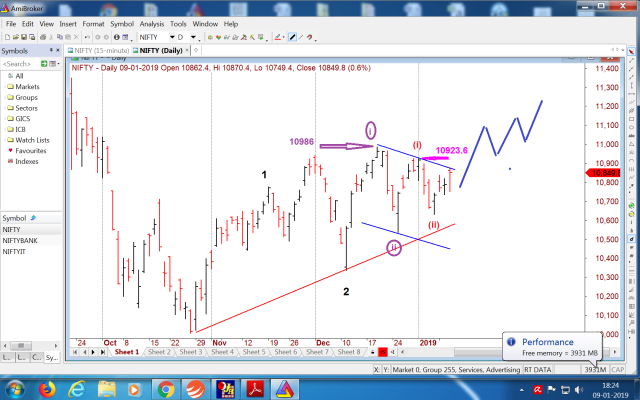
VIEW c ( Alternate 2)

If NIFTY goes above 10985.2 then we have already completed  wave (2) of circled C at 10534 and we are forming  wave (3) of circled wave C which is bullish.See Up Arrow in the chart .This is very similar to “view a” – only difference is- here we have finished wave (2) of circled C and there (view a) we are still forming it.

NIFTY 3


NIFTY 50

DISCLAIMER : THIS IS NOT A TRADING ADVICE, BUT ARE MY THOUGHTS / DISCUSSIONS WITH THOSE WHO ARE INTERESTED IN THE USEFUL APPLICATION OF TECHNICAL ANALYSIS.THIS IS FOR STUDY PURPOSE AND ENTERTAINMENT. WHILE DUE CARE HAS BEEN TAKEN IN PREPARING THESE NOTES/COMMENTS, NO RESPONSIBILITY CAN BE OR IS ASSUMED FOR ANY CONSEQUENCES RESULTING OUT OF ACTING ON THEM.TRADING IN STOCKS/COMMODITIES/FUTURES CARRY RISK.CONSULT YOUR FINANCIAL ADVISOR / SEBI REGISTERED RESEARCH ANALYST ONLY BEFORE YOU TRADE.THIS IS NOT A BUY / SELL RECOMMENDATION  .ONLY BROAD MARKET TRENDS ARE DISCUSSED HERE.

10,779.80      + 49.95    +0.47% 

NIFTY VIEW FOR 28/12/2018 ONWARDS

1) What I said in my previous post  :

We may or may not test 10817-10893 range which are 61.8% & 78.6 % respectively.

what happened:

Wave B touched 10817-10893 range i.e made a high of 10834.2 and retraced from there.

2) What I said in my previous post  :

The upward “(B)” wave can be as simple as shown in blue line up or can even form a triangle or a complex correction.My drawing of Line is not to scale but just indicative of an upward correction.

what happened:

It is right now mimicking as shown by the blue lines in my previous post.

What I think now :

NIFTY is correcting for “B” wave as shown in the chart.It may be simple a-b-c or can be complex.I have shown the fibonacci ratios in Pink colour to show if it retraces deeper.Supports are at 10718/10683/10648 which are 38.2 %/50%/61.8 % respectively.It is not a Must that NIFTY should come and test these levels but Can.

After “B” wave down is over, NIFTY will go to form wave “C” upwards which will complete wave “(B)” shown in red.A move above 10900 will negate my wave count.

NIFTY HOURLY

NIFTY Hourly


NIFTY 50

DISCLAIMER : THIS IS NOT A TRADING ADVICE, BUT ARE MY THOUGHTS / DISCUSSIONS WITH THOSE WHO ARE INTERESTED IN THE USEFUL APPLICATION OF TECHNICAL ANALYSIS.THIS IS FOR STUDY PURPOSE AND ENTERTAINMENT. WHILE DUE CARE HAS BEEN TAKEN IN PREPARING THESE NOTES/COMMENTS, NO RESPONSIBILITY CAN BE OR IS ASSUMED FOR ANY CONSEQUENCES RESULTING OUT OF ACTING ON THEM.TRADING IN STOCKS/COMMODITIES/FUTURES CARRY RISK.CONSULT YOUR FINANCIAL ADVISOR / SEBI REGISTERED RESEARCH ANALYST ONLY BEFORE YOU TRADE.THIS IS NOT A BUY / SELL RECOMMENDATION  .ONLY BROAD MARKET TRENDS ARE DISCUSSED HERE.

10,729.85     + 66.35        + 0.62% 

NIFTY VIEW FOR 27/12/2018 ONWARDS

1) What I said in my previous post  :

 I said NIFTY should not break 10623 if it is forming a-b-c pattern.If it breaks 10623 ,then refer chart 2 and NIFTY will form an Impulse wave.

what happened:

NIFTY broke 10623 and completed an Impulse wave to the downside.

2) What I said in my previous post :

A break to the upside of the down sloping trendline shown , the levels of which are 10640-10680 , will take NIFTY Up.

what happened:

NIFTY broke the down sloping trendline at 10640 and shot up.

What I think now:

An Impulse wave will be normally tested by it’s countertrend wave in opposite direction,the target of which will be wave 4 of one lower degree.In this case it has already tested it i.e 10708 which is wave 4 of lower degree.

Since I am expecting a Zigzag i.e (A)-(B)-(C) down , one can expect the current upwave which is wave “(B)”to travel upto 38.2  % to 78.6 %.We have already tested 38.2 % which is at 10710 and nearing 50 %.We may or may not test 10817-10893 range which are 61.8% & 78.6 % respectively.Since these are guidelines, they are not a must to be touched.

The upward “(B)” wave can be as simple as shown in blue line up or can even form a triangle or a complex correction.My drawing of Line is not to scale but just indicative of an upward correction.

After “(B)” wave correction is over it will form “(C)” wave down which will break today’s bottom of  10534.55 to the least shown by brown line down.

NIFTY HOURLY

nifty

NIFTY 50

DISCLAIMER : THIS IS NOT A TRADING ADVICE, BUT ARE MY THOUGHTS / DISCUSSIONS WITH THOSE WHO ARE INTERESTED IN THE USEFUL APPLICATION OF TECHNICAL ANALYSIS.THIS IS FOR STUDY PURPOSE AND ENTERTAINMENT. WHILE DUE CARE HAS BEEN TAKEN IN PREPARING THESE NOTES/COMMENTS, NO RESPONSIBILITY CAN BE OR IS ASSUMED FOR ANY CONSEQUENCES RESULTING OUT OF ACTING ON THEM.TRADING IN STOCKS/COMMODITIES/FUTURES CARRY RISK.CONSULT YOUR FINANCIAL ADVISOR / SEBI REGISTERED RESEARCH ANALYST ONLY BEFORE YOU TRADE.THIS IS NOT A BUY / SELL RECOMMENDATION  .ONLY BROAD MARKET TRENDS ARE DISCUSSED HERE.

10,663.50   -90.50   -0.84% 

NIFTY VIEW FOR 26/12/2018 ONWARDS

NIFTY is exactly moving as predicted.It corrected to the 50 % fibonacci level.I have given two alternatives.If we are forming a b c then NIFTY should not go below 10623 as in this case the 5 th wave of “c” will become larger than wave 3 and as a result wave 3 will be the shortest wave.This breaks the Elliott Wave Rule ( Elliott wave rule says that wave 3 cannot be the shortest) so we will have to abandon this count and move to chart 2.

If we do not break 10623 , then NIFTY may retrace 80 % to 138.2 % of (10985.2 – low formed).

For NIFTY to show strength, it should break the blue trendlines which have values from 10640-10680.

CHART 1 – NIFTY HOURLY

NIFTY 1

If NIFTY breaks below 10623, see chart 2.Here we may be forming an Impulse pattern currently. Bounceback here will be limited to 61.8 % to 79 % of (10985.2- Low made).

CHART 2 – ALTERNATIVE        NIFTY HOURLY

Nifty 2